Sidebar
Reports / Statistics
If you have been using jNews to send out email newsletters, you can monitor your newsletter statistics in graphical or detailed view. You can also import via CSV format data about the people who saw, opened, and clicked through your emails.
In the administration panel, go to Components >> jNews >> Statistics
Setup the filters the way you want the report to be generated. This can be generated into either Listing or Graph type.
By default, the filters are set by the interval of “Weekly” and with the range date of “This Month” means the start date will start at the beginning of the month until the current date. The page will generate a listing page.
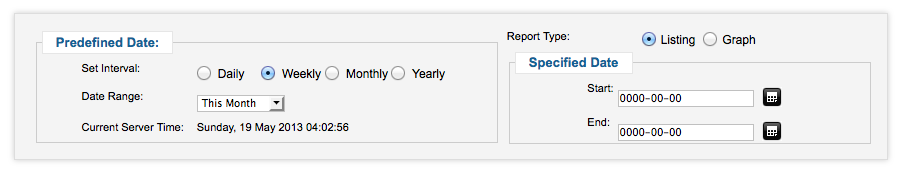
- To change the intervals, just select which intervals you want in the radio list of “Set Interval”.
- To change the range of dates, select in the dropdown list of “Date Range”.
- To filter the reports on a specific date, click the calendar button at the “Specified Date” field set. Start calendar as the start date and End for the end date range.
- To change the view of the reports from Listing of data to Graph, select the “Graph” from the Report type radio list.
Click Generate at the upper right to generate a new report based on the given filters. Or click Refresh to set the filters back into default settings.
Export jNews Report into CSV File
- In the administration panel, go to Components >> jNews >> Statistics
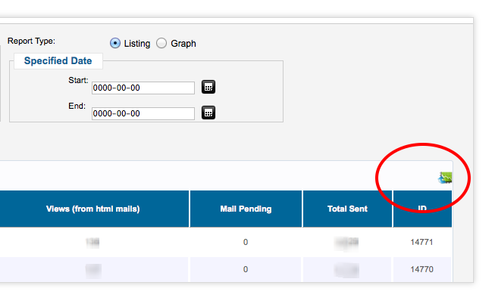
- An export icon is found at the upper right of each tab on each reports whether its listing or graph. Here are the following reports (listing and graph):
- Click the export icon to export the file. Once clicked, download dialogue box will pop-up.
- Click Save to save the file else Open and choose which application you want to use to open a file.